Some of what South African businesses need to know has never been put in one place. It sits in hundreds of PDFs, scanned gazettes and council websites, or nowhere at all. We build it into datasets: checked against the source, kept current, ready for your systems.
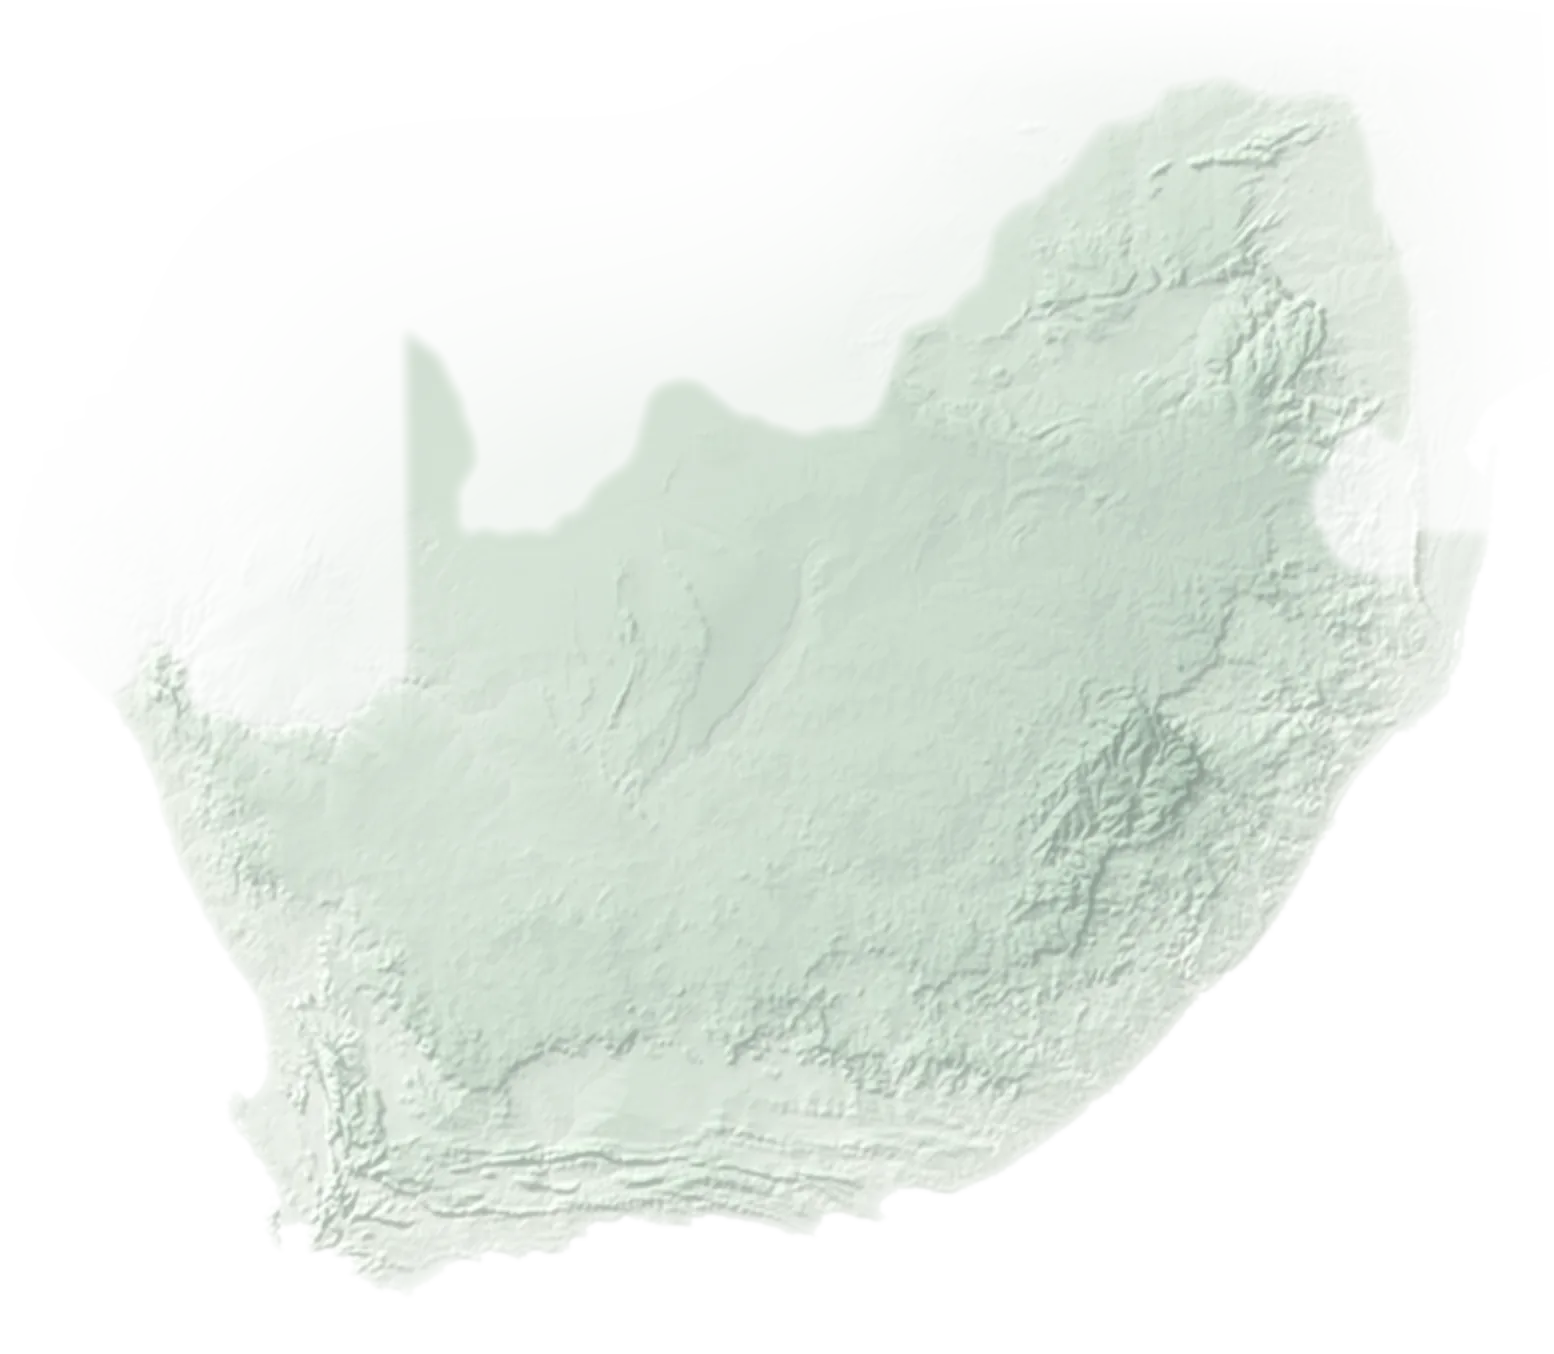
Hatched: data that doesn’t exist yetThe eight metros, first in the electricity surveyRelief and contours from SRTM elevation data
The gap
The facts exist. Nobody has put them together.
Take electricity. Every municipality that sells power has its tariff approved by NERSA each year. For 2026/27, the regulator published those decisions as 173 separate PDFs: no spreadsheet, no single list, a different layout from one to the next.
Water is worse. There is no national database of municipal water tariffs at all, and the Reserve Bank has recommended that one be built.
173 NERSA decisions, one square each. Scroll, and they fall into one dataset.City of Cape Town: captured, checked and below as a sample.
City of Cape Town · Non-residential solar feed-in (SSEG) · c/kWh
Retyped from NERSA’s decision, page 36
Tariff
2025/26
2026/27
Stated change
SSEG feed-in tariff 1
90.17
96.18
6.67%
SSEG feed-in tariff 2
71.37
768.46
−4.08%
71.37 less 4.08% is 68.46. A stray digit turned a solar export credit of 68 cents per kWh into R7.68, and it was approved as printed. Source documents contain errors. We keep the published figure, flag it, and show the value its own percentage implies.
A real record
One figure, checked, with its source
City of Cape Town’s domestic tariff for 2026/27, captured from NERSA’s decision and checked against it. This is what every record looks like.
UM-001 · za-cpt-res-domestic-2026-27
City of Cape Town · Residential: Domestic
2026/27 · approved by NERSA on 11 May 2026 · effective 1 July 2026
Charge
Unit
2025/26
2026/27
Change
Energy, block 1 (0 to 600 kWh)
c/kWh
308.58
348.37
+12.90%
Energy, block 2 (above 600 kWh)
c/kWh
370.21
418.03
+12.92%
Service and wires charge
R/month
59.90
65.02
+8.55%
Service and wires charge
R/day
new
2.14
new
GET /v1/tariffs/za-cpt-res-domestic-2026-27Preview: the API opens to founding customers in December 2026
za-electricity-tariffs-2026-27.csvOne row per charge
distributor,tariff,year,charge,unit,value,previous,source_page
City of Cape Town,Residential: Domestic,2026/27,energy_block_1,c/kWh,348.37,308.58,31
City of Cape Town,Residential: Domestic,2026/27,energy_block_2,c/kWh,418.03,370.21,31
City of Cape Town,Residential: Domestic,2026/27,service_and_wires,R/month,65.02,59.90,31
City of Cape Town,Residential: Domestic,2026/27,service_and_wires,R/day,2.14,,31
Method
From page 31 to your system
How one figure becomes data you can build on. Every value we publish goes through the same four steps.
NERSA · City of Cape Town · p. 31
Block 1 (0-600 kWh)348.37
01
Official sources first
Regulators’ decisions, gazettes and council tariff books. Every value keeps its document and page.
Recomputed
308.58 → 348.37
+12.90%
Matches the table
02
Checked, not copied
Each figure is tested against the source’s own percentages and totals. Errors are flagged, never quietly fixed.
The same record as an API, a CSV download or a change alert, ready for billing, pricing or analysis.
Example alert
Cape Town · Domestic
Block 1 rises to 348.37 c/kWh on 1 July 2026 (+12.90%)
04
Kept current
Drafts, approvals and court set-asides, through every regulatory cycle, with the full history kept.
We map places, prices, rules and organisations. Never people.
Who it’s for
For the people who price, bill and lend
Sub-metering and tenant billing
What does each tenant owe under the new tariff from 1 July?
Every block, fixed and time-of-use charge, by distributor, in one format your billing system reads.
Solar and energy proposals
What will a rooftop system save in Polokwane compared with Cape Town?
Energy rates and feed-in credits for every municipality, so each proposal uses the client’s real tariff.
Property owners and managers
What will electricity add to costs across our portfolio next year?
The tariff behind every building, with history and next year’s drafts as they’re published.
Lending and research
Which municipalities’ tariffs rose fastest, and what does that do to affordability?
Consistent, sourced series you can analyse and cite, with every figure traceable to its page.
Datasets
What we’re mapping, and what’s next
Tell us which ones you need: it decides what we build first.
UM-001Early access · December 2026
Municipal electricity tariffs
Every NERSA-approved tariff for South Africa’s municipal distributors, plus Eskom’s: residential, commercial, industrial, time-of-use, solar feed-in and wheeling charges, with each figure linked to its source page.
For sub-metering and tenant billing, property, solar and energy proposals, lending and research.
Municipal electricity tariffs, for the first companies that need them, at a price that stays.
R2,500 a month
or R25,000 a year, paid upfront
Founding price, locked for as long as you subscribe.
The eight metros and the next 12 largest distributors by 31 January 2027
Every municipal distributor and Eskom by 1 July 2027
The 2027/28 draft-tariff tracker, March to June 2027
API, CSV downloads and change alerts
A say in which distributors and fields come first
Your money back if we deliver late
No payment now: we’ll send you a proposal. The official source prevails where it differs from our data.
Requests
Request a dataset
Tell us what’s missing. We read every request, and when enough companies need the same data, it becomes a survey. You hear first.
Good requests name the decision the data feeds: a price, a bill, a loan, a site choice. That tells us what “correct” has to mean.
FAQ
Questions buyers ask
Isn’t this data already public?
The decisions are public, but not usable as data. Each distributor’s tariff sits in its own PDF with its own layout, and municipal tariff books add more. We turn them into one consistent, checked dataset with history, so your systems can read it.
Which distributors do you cover?
Every municipal distributor with a NERSA-approved tariff, plus Eskom’s tariffs. The eight metros come first in December 2026, the next 12 largest by 31 January 2027, and the rest by 1 July 2027. Private licensed distributors, such as some industrial parks, aren’t in the first release. Tell us if you need one.
Where do the figures come from, and what if sources disagree?
NERSA’s decision for each distributor first, then the municipality’s own tariff book. Where the two differ, we keep both and flag the difference rather than choosing one silently.
What happens when a tariff changes or is set aside?
Each record has a status: draft, approved, set aside or redetermined. Courts have set aside approved municipal tariffs before, and NERSA has had to redetermine them. When a record you use changes status or value, you get an alert, and the old version stays in the history.
Are rates with or without VAT?
We record each figure exactly as its source publishes it, with a VAT field: included, excluded, or not stated. Sources differ, and some don’t say.
Which charges are included?
Energy blocks, fixed and daily charges, capacity and demand charges, time-of-use rates by season, prepaid and conventional meters, solar feed-in credits and wheeling charges, wherever the source publishes them.
How much history is there?
Two years at launch: 2025/26 and 2026/27, each with its approved figures. Earlier years can follow if founding customers need them.
Can we put the rates on our customers’ bills or in our app?
That’s what the founding licence is for: using the data in your own bills, quotes and tools. Republishing the dataset itself isn’t included. The proposal we send spells out the licence.
You’re a new company. What if you stop?
Founding customers can download everything they’ve paid for as CSV at any time, so the data stays theirs. And if we deliver late, they get their money back.