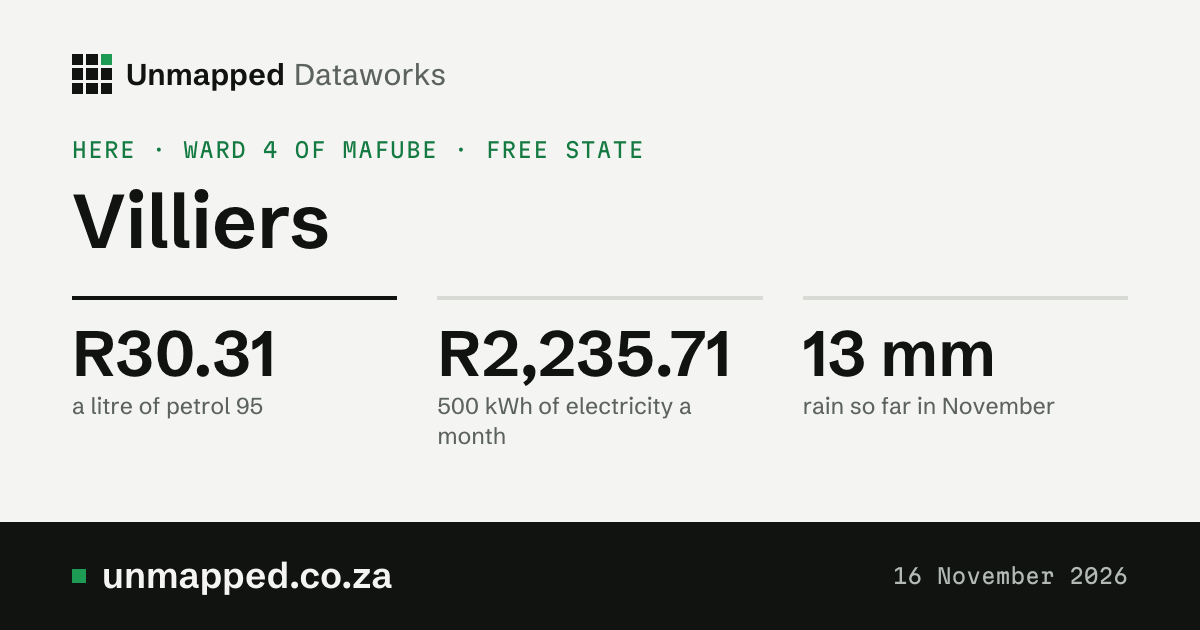
Villiers
Town · Ward 4 of Mafube · Free State
Who governs this spot
- Ward, 2026 boundaries
- Ward 4 42005004
- Municipality
- Mafube
- District
- Fezile Dabi
- Province
- Free State
The ward is the one this point falls in under the 2026 boundaries, in force from 4 November 2026.
Source: Municipal Demarcation Board, ward and municipal boundaries, simplified. The ward lookup
Greenness of this ward
0.37NDVI in October 2026
0.24a normal October, 1984 to 2020
Well above normalagainst normal
Tallest 0.59
NDJFMAMJJASO
Show the numbers
| When or what | Figure |
|---|---|
| Nov 2025 | 0.42, normal 0.31 |
| Dec 2025 | 0.49, normal 0.39 |
| Jan 2026 | 0.56, normal 0.49 |
| Feb 2026 | 0.59, normal 0.52 |
| Mar 2026 | 0.54, normal 0.48 |
| Apr 2026 | 0.48, normal 0.40 |
| May 2026 | 0.39, normal 0.31 |
| Jun 2026 | 0.30, normal 0.24 |
| Jul 2026 | 0.27, normal 0.21 |
| Aug 2026 | 0.25, normal 0.20 |
| Sep 2026 | 0.31, normal 0.21 |
| Oct 2026 | 0.37, normal 0.24 |
90% of the ward was seen through the clouds in October. A paler bar is a month seen over less than half the ward.
The greenness score (NDVI) is how green the land looks from space, from about 0 (bare ground, rock, water) to about 0.9 (dense green growth). It follows rain, season, crops and fire. A month’s figure is the mean over the whole place where the satellite saw the ground (clouds hide some).
Source: NDVI Anomaly and NDVI Climatology, Digital Earth Africa (CC BY 4.0), modified; Landsat imagery courtesy of the U.S. Geological Survey; contains modified Copernicus Sentinel data 2017 to 2026. Second reading: generated using European Union’s Copernicus Land Monitoring Service information (NDVI 300 m, version 3), modified. What we changed: we averaged Digital Earth Africa’s monthly NDVI over each 2026 ward at 240 m (its own 8 by 8 averages of the 30 m pixels) and wards up to municipalities, districts and provinces by area; CLMS’s three 10-day NDVI images a month averaged the same way.
Drought in this ward
No droughtin October 2026
+1.82the drought index
+1.66rain over 12 months, against normal
Show the numbers
| When or what | Figure |
|---|---|
| November 2024 | −0.92, dry |
| December 2024 | −1.27, moderate drought |
| January 2025 | −0.39, no drought |
| February 2025 | +0.43, no drought |
| March 2025 | +1.19, no drought |
| April 2025 | +1.49, no drought |
| May 2025 | +1.29, no drought |
| June 2025 | +1.33, no drought |
| July 2025 | +0.95, no drought |
| August 2025 | +1.14, no drought |
| September 2025 | +1.49, no drought |
| October 2025 | +1.53, no drought |
| November 2025 | +1.96, no drought |
| December 2025 | +1.81, no drought |
| January 2026 | +1.74, no drought |
| February 2026 | +1.08, no drought |
| March 2026 | +1.28, no drought |
| April 2026 | +1.33, no drought |
| May 2026 | +1.45, no drought |
| June 2026 | +1.50, no drought |
| July 2026 | +1.49, no drought |
| August 2026 | +1.54, no drought |
| September 2026 | +2.28, no drought |
| October 2026 | +1.82, no drought |
<a href="/drought/ward-42005004">The ward’s drought month by month, with the dams and rain</a>
The drought index puts four measures on one scale, each in standard deviations from its 1991 to 2020 normal for the time of year (minus is drier): rain over the last 3 months and the last 12 (from ERA5-Land), rain less evaporation over 12 months (ERA5-Drought’s SPEI, so a hot, dry year counts for more), and how green the land is (from space, since 2017). The index is their mean. Rain and evaporation are modelled estimates from a weather reanalysis, averaged over the whole place, not station readings; greenness is measured from space. This is not an official drought declaration: those come from the National Disaster Management Centre.
Source: Contains modified Copernicus Climate Change Service information 1950 to 2026 (ERA5-Land, for rain; ERA5-Drought, for SPEI). Neither the European Commission nor ECMWF is responsible for any use that may be made of the Copernicus information or data it contains. Greenness: NDVI Anomaly, Digital Earth Africa (CC BY 4.0), modified; Landsat imagery courtesy of the U.S. Geological Survey; contains modified Copernicus Sentinel data 2017 to 2026.