How full · 9 November 2026
Douglas Weir Dam
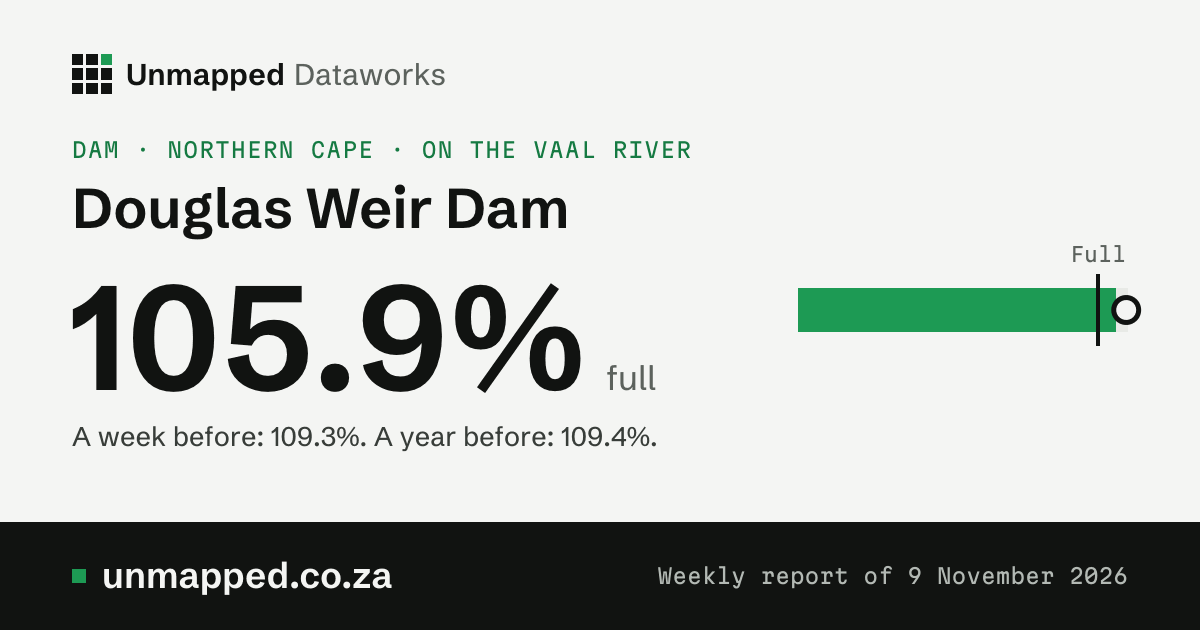
105.9% full
A week before: 109.3%. A year before: 109.4% (the ring on the bar).
- Last week
- 109.3%
- A year ago
- 109.4%
- Holds when full
- 16.3 million m³
- Holds now
- 17.3 million m³
The level, week by week
25 Aug 20259 Nov 2026
Show the numbers
| When or what | Figure |
|---|---|
| 9 November 2026 | 105.9% full, a year earlier 109.4% |
| 2 November 2026 | 109.3% full, a year earlier 105.4% |
| 26 October 2026 | 112.3% full, a year earlier 105.9% |
| 19 October 2026 | 113.8% full, a year earlier 109.2% |
| 12 October 2026 | 113.3% full, a year earlier 109.8% |
| 5 October 2026 | 126.2% full, a year earlier 111.2% |
| 31 August 2026 | 110.8% full, a year earlier 112.3% |
| 24 August 2026 | 110.8% full, a year earlier 112.4% |
| 17 August 2026 | 111.3% full, a year earlier 113% |
| 10 August 2026 | 111.3% full, a year earlier 112.8% |
| 3 August 2026 | 111.8% full, a year earlier 112.3% |
| 29 June 2026 | 114.8% full, a year earlier 111.3% |
| 22 June 2026 | 114.3% full, a year earlier 111.6% |
| 15 June 2026 | 116.8% full, a year earlier 113.3% |
| 8 June 2026 | 117.3% full, a year earlier 111.4% |
| 1 June 2026 | 115.8% full, a year earlier 115.7% |
| 25 May 2026 | 125.1% full, a year earlier 118.9% |
| 18 May 2026 | 132.7% full, a year earlier 124.9% |
| 11 May 2026 | 133.8% full, a year earlier 133.8% |
| 4 May 2026 | 133.8% full, a year earlier 133.8% |
| 20 April 2026 | 118.9% full, a year earlier 133.8% |
| 13 April 2026 | 117.3% full, a year earlier 133.8% |
| 6 April 2026 | 125.1% full, a year earlier 133.5% |
| 30 March 2026 | 131% full, a year earlier 128.7% |
| 16 March 2026 | 121.5% full, a year earlier 119.6% |
| 9 March 2026 | 114.8% full, a year earlier 125.7% |
| 2 March 2026 | 112.3% full, a year earlier 109.5% |
| 23 February 2026 | 110.3% full, a year earlier 110.1% |
| 16 February 2026 | 111.3% full, a year earlier 109.5% |
| 9 February 2026 | 106.8% full, a year earlier 110.4% |
| 2 February 2026 | 109.8% full, a year earlier 105% |
| 26 January 2026 | 113.3% full, a year earlier 102.8% |
| 19 January 2026 | 119.4% full, a year earlier 107% |
| 12 January 2026 | 122.5% full, a year earlier 108% |
| 5 January 2026 | 125.1% full, a year earlier 109.4% |
| 29 December 2025 | 124.6% full, a year earlier 107.8% |
| 15 December 2025 | 133.8% full, a year earlier 106.9% |
| 8 December 2025 | 133.8% full, a year earlier 107.4% |
| 1 December 2025 | 133.8% full, a year earlier 108% |
| 24 November 2025 | 133.8% full, a year earlier 109.2% |
| 17 November 2025 | 109.8% full, a year earlier 108.7% |
| 10 November 2025 | 110.3% full, a year earlier 103.7% |
| 3 November 2025 | 108.3% full, a year earlier 97% |
| 27 October 2025 | 106.8% full, a year earlier 97.2% |
| 20 October 2025 | 108.8% full, a year earlier 104.5% |
| 13 October 2025 | 109.3% full, a year earlier 105% |
| 6 October 2025 | 110.8% full, a year earlier 107.3% |
| 29 September 2025 | 110.3% full, a year earlier 108.9% |
| 22 September 2025 | 110.3% full, a year earlier 108.5% |
| 15 September 2025 | 111.3% full, a year earlier 108.4% |
| 8 September 2025 | 112.8% full, a year earlier 108.4% |
| 1 September 2025 | 112.3% full, a year earlier 109% |
| 25 August 2025 | 112.3% full, a year earlier 108.9% |
Source: Weekly State of Dams, 2026-11-09, Department of Water and Sanitation, station C9R003
Rain on the dam’s ward
Tallest 154 mm
NDJFMAMJJASO
Show the numbers
| When or what | Figure |
|---|---|
| Nov 2025 | 39 mm, normal 44 mm |
| Dec 2025 | 68 mm, normal 52 mm |
| Jan 2026 | 13 mm, normal 65 mm |
| Feb 2026 | 141 mm, normal 57 mm |
| Mar 2026 | 91 mm, normal 63 mm |
| Apr 2026 | 154 mm, normal 38 mm |
| May 2026 | 29 mm, normal 16 mm |
| Jun 2026 | 12 mm, normal 11 mm |
| Jul 2026 | 1 mm, normal 5 mm |
| Aug 2026 | 8 mm, normal 8 mm |
| Sep 2026 | 81 mm, normal 13 mm |
| Oct 2026 | 17 mm, normal 27 mm |
2.4 mm of rain so far in November; a normal November has 44 mm. This is the rain on ward 3 of Siyancuma, the ward the dam lies in: not on its whole catchment, which we don’t hold. Rain upstream fills a dam, so the two don’t have to move together.
Modelled estimates from a weather reanalysis, averaged over the whole place: not readings from a weather station, and not a forecast. The weather model runs about five days behind the weather, so the newest day here is usually five to twelve days ago.
Source: ERA5-Land, Copernicus Climate Change Service. The weather there, day by day
Where it is
- River
- Vaal River
- In
- Northern Cape
- Holds when full
- 16.3 million m³
- Holds now
- 17.3 million m³
- Ward
- ward 3 of Siyancuma
Towns nearby
The nearest towns in a straight line from the dam. Being near a dam doesn’t mean a town gets its water from it: we hold no link yet between dams and the towns they supply.
Position and towns: © OpenStreetMap contributors, ODbL 1.0.
From space
Pictures from space: coming. A then-and-now pair and one picture a year for each dam will show here once that release is checked and out. Until then this stays empty: we don’t show a stand-in picture.