How full · 9 November 2026
Vaal Dam
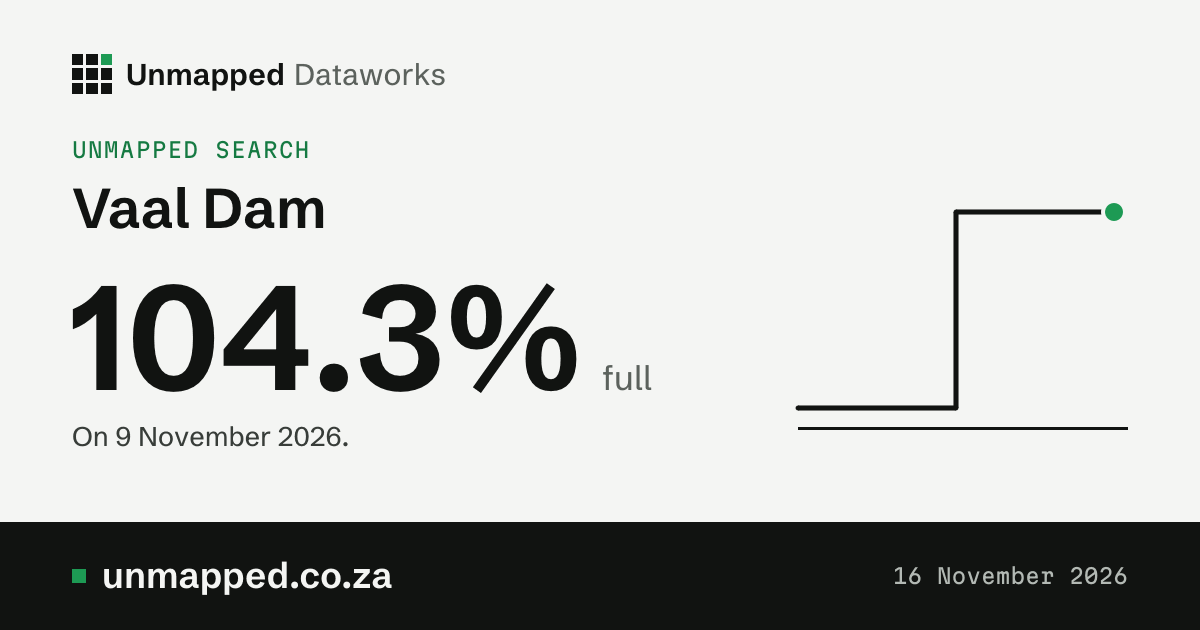
104.3% full
A week before: 105.1%. A year before: 101.2% (the ring on the bar).
- Last week
- 105.1%
- A year ago
- 101.2%
- Holds when full
- 2,561.0 million m³
- Holds now
- 2,671.1 million m³
The level, week by week
25 Aug 20259 Nov 2026
Show the numbers
| When or what | Figure |
|---|---|
| 9 November 2026 | 104.3% full, a year earlier 101.2% |
| 2 November 2026 | 105.1% full, a year earlier 101.1% |
| 26 October 2026 | 106.1% full, a year earlier 101.4% |
| 19 October 2026 | 107.4% full, a year earlier 102.3% |
| 12 October 2026 | 108.2% full, a year earlier 102.8% |
| 5 October 2026 | 95.4% full, a year earlier 103.3% |
| 31 August 2026 | 100.6% full, a year earlier 106.7% |
| 24 August 2026 | 101% full, a year earlier 107.1% |
| 17 August 2026 | 101.5% full, a year earlier 107.8% |
| 10 August 2026 | 101% full, a year earlier 107.2% |
| 3 August 2026 | 101.3% full, a year earlier 106.4% |
| 29 June 2026 | 104.1% full, a year earlier 107.8% |
| 22 June 2026 | 104.5% full, a year earlier 108.5% |
| 15 June 2026 | 104.7% full, a year earlier 108.6% |
| 8 June 2026 | 105.2% full, a year earlier 108.3% |
| 1 June 2026 | 106.1% full, a year earlier 108.3% |
| 25 May 2026 | 107.3% full, a year earlier 108.3% |
| 18 May 2026 | 109% full, a year earlier 108.6% |
| 11 May 2026 | 111% full, a year earlier 109.8% |
| 4 May 2026 | 105.1% full, a year earlier 112.4% |
| 20 April 2026 | 102.1% full, a year earlier 108.8% |
| 13 April 2026 | 103% full, a year earlier 115.3% |
| 6 April 2026 | 104.6% full, a year earlier 109.5% |
| 30 March 2026 | 104.5% full, a year earlier 107.2% |
| 16 March 2026 | 100.5% full, a year earlier 103.5% |
| 9 March 2026 | 101.4% full, a year earlier 101.8% |
| 2 March 2026 | 100.1% full, a year earlier 93.1% |
| 23 February 2026 | 100.2% full, a year earlier 81% |
| 16 February 2026 | 101.1% full, a year earlier 63.4% |
| 9 February 2026 | 101.5% full, a year earlier 61.8% |
| 2 February 2026 | 101.6% full, a year earlier 61.3% |
| 26 January 2026 | 100.9% full, a year earlier 61.6% |
| 19 January 2026 | 100.9% full, a year earlier 57.9% |
| 12 January 2026 | 102% full, a year earlier 35% |
| 5 January 2026 | 103.8% full, a year earlier 24% |
| 29 December 2025 | 103.6% full, a year earlier 24.3% |
| 15 December 2025 | 102.3% full, a year earlier 25.4% |
| 8 December 2025 | 100.4% full, a year earlier 26.8% |
| 1 December 2025 | 103.4% full, a year earlier 28.6% |
| 24 November 2025 | 101.3% full, a year earlier 30% |
| 17 November 2025 | 109.3% full, a year earlier 30.9% |
| 10 November 2025 | 101% full, a year earlier 31.8% |
| 3 November 2025 | 101% full, a year earlier 33.4% |
| 27 October 2025 | 101% full, a year earlier 35% |
| 20 October 2025 | 101.8% full, a year earlier 36.5% |
| 13 October 2025 | 102.5% full, a year earlier 38.1% |
| 6 October 2025 | 103.4% full, a year earlier 39.6% |
| 29 September 2025 | 102.3% full, a year earlier 40.9% |
| 22 September 2025 | 103.6% full, a year earlier 41.8% |
| 15 September 2025 | 105% full, a year earlier 42.6% |
| 8 September 2025 | 105.9% full, a year earlier 43.6% |
| 1 September 2025 | 106.7% full, a year earlier 44.5% |
| 25 August 2025 | 107% full, a year earlier 45.4% |
Source: Weekly State of Dams, 2026-11-09, Department of Water and Sanitation, station C1R001
Rain on the dam’s ward
Tallest 231 mm
NDJFMAMJJASO
Show the numbers
| When or what | Figure |
|---|---|
| Nov 2025 | 231 mm, normal 105 mm |
| Dec 2025 | 140 mm, normal 144 mm |
| Jan 2026 | 122 mm, normal 129 mm |
| Feb 2026 | 73 mm, normal 94 mm |
| Mar 2026 | 163 mm, normal 86 mm |
| Apr 2026 | 93 mm, normal 45 mm |
| May 2026 | 41 mm, normal 18 mm |
| Jun 2026 | 12 mm, normal 9 mm |
| Jul 2026 | 1 mm, normal 6 mm |
| Aug 2026 | 52 mm, normal 15 mm |
| Sep 2026 | 106 mm, normal 22 mm |
| Oct 2026 | 12 mm, normal 80 mm |
12 mm of rain so far in November; a normal November has 105 mm. This is the rain on ward 1 of Metsimaholo, the ward the dam lies in: not on its whole catchment, which we don’t hold. Rain upstream fills a dam, so the two don’t have to move together.
Modelled estimates from a weather reanalysis, averaged over the whole place: not readings from a weather station, and not a forecast. The weather model runs about five days behind the weather, so the newest day here is usually five to twelve days ago.
Source: ERA5-Land, Copernicus Climate Change Service. The weather there, day by day
Where it is
- River
- Vaal River
- In
- Free State
- Holds when full
- 2,561.0 million m³
- Holds now
- 2,671.1 million m³
- Ward
- ward 1 of Metsimaholo
Towns nearby
The nearest towns in a straight line from the dam. Being near a dam doesn’t mean a town gets its water from it: we hold no link yet between dams and the towns they supply.
Position and towns: © OpenStreetMap contributors, ODbL 1.0.
From space
Vaal Dam from space
From space on 1 Nov 2026, the water covered 95% of Vaal Dam’s full outline (301.7 of 316.6 km²). That fits a dam about 99% full (our estimate, usually within 6 points). The Department of Water and Sanitation’s own figure for the week of 9 Nov 2026 is 104.3%.
Two ways to say how full Vaal Dam is
- DWS
- 104.3% full by volume
- Weekly State of Dams, 9 Nov 2026
- From space, by volume
- about 99% full (93 to 105%)
- Our estimate from the area, 1 Nov 2026, on a curve fitted to 47 of DWS’s own weekly figures; nine in ten held-out weeks were within 6 points. How we estimate % full from space
- From space
- 95.3% of the full area covered
- Sentinel-2, 1 Nov 2026
DWS measures how much water is stored (volume). From space we measure how much ground the water covers (area). A dam’s sides slope, so it is deep at the wall and shallow at the edges: as it empties, the deep water goes while the surface stays wide, so the area falls more slowly than the volume. The two numbers differ even when both are right. In the sketch the level has dropped to 60% of the depth (the dashed line is full): the water still spans 60% of the width and, in a bowl like this, covers about a third of the full area, yet holds only about a fifth of the water.
How we estimate % full by volume from space
For each month with a clear view we take the edge of the water seen by Sentinel-2 and read the height of the ground there from the Copernicus elevation model (GLO-30, 30 m). Heights against areas give the dam’s area-to-height curve, fitted as a smooth curve that only rises. The water held between two levels is the area added up over the height between them. Starting from full, with the full-supply capacity in our dam-levels records (2,561.0 million m³), the water lost down to a month’s level gives that month’s % full by volume. We show it only where the months spread over enough levels and the curve fits well (R² 0.8 or more); otherwise we say “not enough range yet”. The elevation model was made from radar passes in 2010 to 2015 and shows each lake as a flat surface at its level then, so below that level it has no heights: for many dams only the months near full can be used. This dam: 11 of 17 months read had a shoreline above the elevation model’s water line. An estimate, not a measurement: it can be several points off, and DWS’s figure comes from gauged levels.
Produced using Copernicus WorldDEM-30 © DLR e.V. 2010-2014 and © Airbus Defence and Space GmbH 2014-2018 provided under COPERNICUS by the European Union and ESA; all rights reserved. The organisations in charge of the Copernicus programme by law or by delegation do not incur any liability for any use of the Copernicus WorldDEM-30.
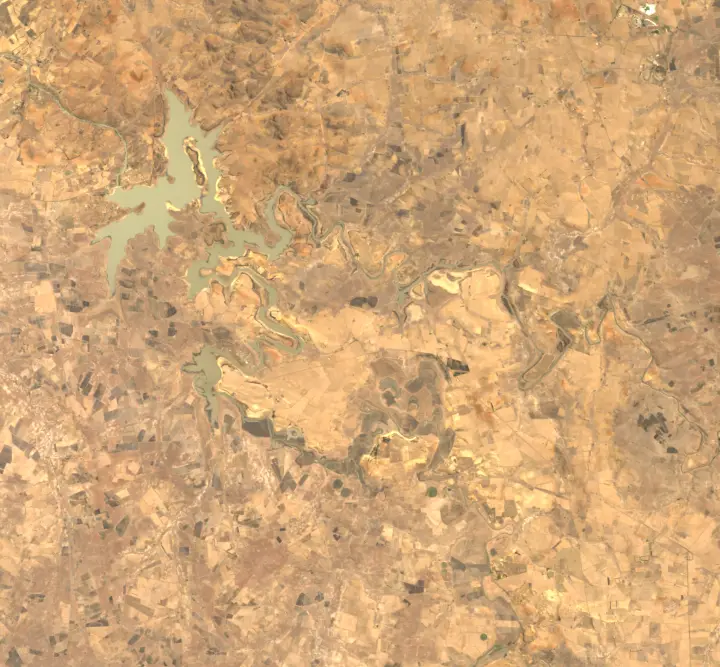
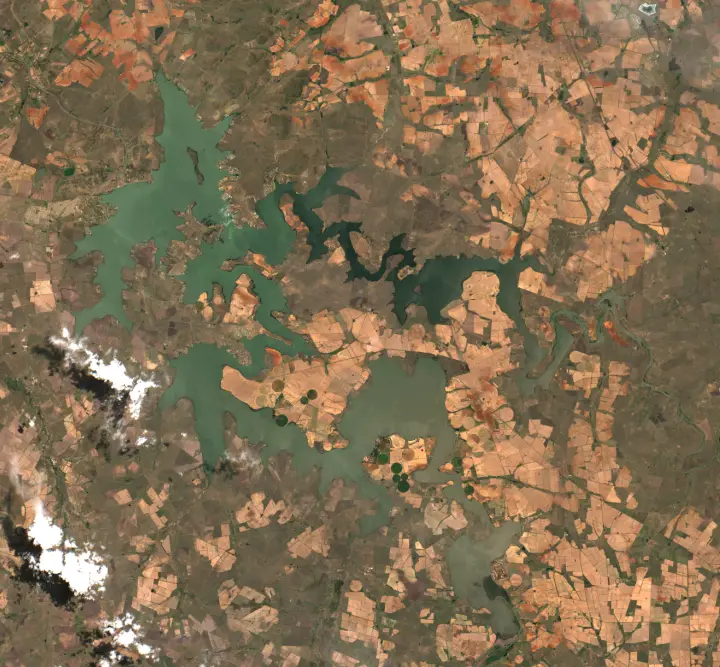 1995 (Landsat, whole year)1 Nov 2026
One picture a year
Vaal Dam: water seen from space and DWS’s level
Water area from space (% of the full footprint)DWS level (% of full supply volume)Our estimate by volume, from space
The chart needs JavaScript.
Vaal Dam: every clear look from space since 1984
Water area, each clear Landsat look (% of the full outline)DWS level (% of full supply volume)
The chart needs JavaScript.
2 looks set aside: likely muddy water read as land
Water Observations from Space can read muddy water as land, so a look can show the dam nearly empty between looks that show it well filled. A look is set aside when its water is under half of both the looks before it and the looks after it (the median of up to three on each side, within 180 days), at least 20 points of full below them, no other look within 30 days reads it as low, and neither Sentinel-2 (within 10 days) nor DWS’s weekly level (within 7 days) shows the dam that low. Such a look is kept in the record but left out of the chart, the yearly water and the driest year.
- 6 May 1990: 1.7% of full, against 90.7% in the looks before and 87.0% in the looks after
- 10 Nov 2006: 1.1% of full, against 90.0% in the looks before and 83.4% in the looks after
See it in the Copernicus Browser, the European Space Agency’s free viewer, on the newest image: Sentinel-2, true colour.
How we estimate % full from space, and how well it does for Vaal Dam
- The curve. 47 clear months since 26 Apr 2021 paired with DWS’s % full for the same days (read between the weekly reports either side). A rising curve, % full = c × (% of the area)1.87, used between 71% and 102% of the area.
- Tested on weeks it didn’t see. Each year left out in turn and estimated from the others: typical error 3.0 points, on average 0.0 high; nine in ten within 6 points, the band we show. Fitted only on the months before 3 May 2026 and tested on the 5 after: typical error 2.8 points, 4 of 5 within the band.
- Radar for cloudy weeks. Sentinel-1 sees through cloud. From 1 Jan 2025, 54 of its 191 passes saw the whole footprint with a clear split between water and land (wind roughens water and makes it look like land; those passes are left out, and of the passes within three days of a report the largest water area is used). Scaled to Sentinel-2 on 10 days both saw the dam (× 1.08). Of DWS’s 83 weekly reports since then, 18 had a clear Sentinel-2 view within three days and 39 more only radar. On radar weeks our estimate was off DWS by 5.5 points on average (37 weeks); on Sentinel-2 weeks by 2.7.
- The footprint. 316.6 km² from Digital Earth Africa’s 40 years of water against 262.4 km² in OpenStreetMap’s outline; they overlap 83% (shared area over the area of either); 54.6 km² is in the footprint only and 0.2 km² in the outline only.
- Each reading. A month is used when at most 5% of the footprint is under cloud or has no data: in the 116 months used, a median of 100.0% of it was clear (the worst 96.4%).
- Shoreline pixels. A 20 m pixel at the edge is partly water and partly land; it counts as water when the satellite’s classification says water, else not at all. In a typical month 12.0% of the water area is such edge pixels; half of that is the most the edge can move the area either way.
- Water outside the footprint. None worth noting in the months used.
Area is turned into % full by volume on this dam’s own curve, so the estimate is ours, not DWS’s. It can be off where the water’s edge is hard to see (shallow, muddy or weedy margins) or at levels the curve hasn’t seen. Where DWS and the estimate differ by more than the band, the page says so, without saying which is right.
How we measure a dam from space
Every month since January 2017 the European Space Agency’s Sentinel-2 satellites have pictured it; we measure the water in the clearest picture of each month. Before that, the Landsat satellites, through Digital Earth Africa, give the water in every clear look since 1984 (403 looks) and a picture a year.
Over the year to the newest DWS report, DWS’s level moved up 27.7 points and the water area seen from space up 19.2 points of full.
The chart counts the pixels of Sentinel-2’s water class at 60 m in the clearest scene of each month (at most 5% of the dam hidden by cloud), inside the dam’s footprint from Digital Earth Africa’s 40 years of water (Digital Earth Africa Water Observations from Space, all-time summary 1984 to 2025 (CC BY 4.0), modified).
Measured from space by Unmapped Dataworks, not by DWS: the water is the satellites’ own water class (Sentinel-2 Level-2A scene classification; for Landsat, Digital Earth Africa’s Water Observations from Space) inside the dam’s footprint widened by 40 m: the ground Digital Earth Africa saw under water in at least 10% of its clear Landsat looks from 1984 to 2025, joined to the dam (316.6 km²; OpenStreetMap’s outline, which we use for the dam’s name and place, covers 262.4 km²; Landsat’s yearly water is still measured in OpenStreetMap’s outline), so shallow or muddy edges, floating plants and shadow can count wrong. 116 of 119 months had a clear view. Footprint: Digital Earth Africa Water Observations from Space, all-time summary 1984 to 2025 (CC BY 4.0), modified. The outline is OpenStreetMap’s (© OpenStreetMap contributors, ODbL; the outlines and how we match them). Pictures: Copernicus Sentinel data, free, full and open; Landsat courtesy of the U.S. Geological Survey, through Digital Earth Africa (CC BY 4.0). Radar: Contains modified Copernicus Sentinel data 2025-2026 (Sentinel-1 radar, processed by Digital Earth Africa).