Ntsimekweni
Town · Ward 11 of Senqu · Eastern Cape
Who governs this spot
- Ward, 2026 boundaries
- Ward 11 21402011
- Before 4 November 2026
- The same ward number, on the 2021 lines
- Municipality
- Senqu
- District
- Joe Gqabi
- Province
- Eastern Cape
The ward is the one this point falls in under the 2026 boundaries, in force from 4 November 2026.
Source: Municipal Demarcation Board, ward and municipal boundaries, simplified. The ward lookup
Weather in this ward
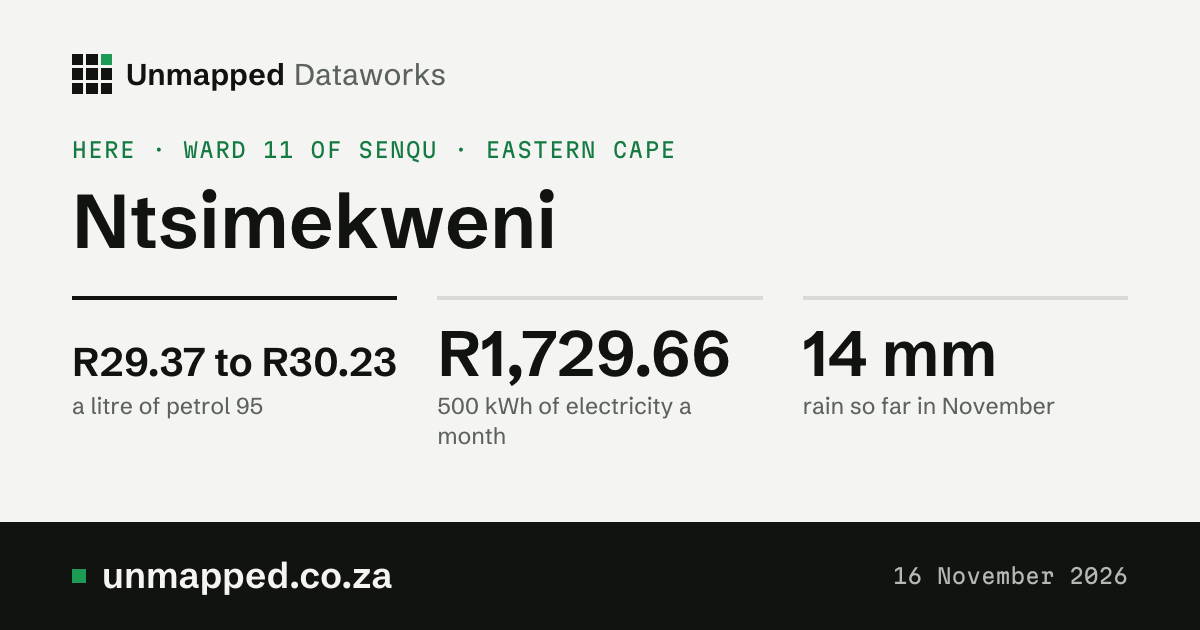
14 mmrain so far in November (1 to 5 November)
119 mma normal November, all month
29.7 °Chottest day this month, 5 November
Tallest 328 mm
NDJFMAMJJASO
Show the numbers
| When or what | Figure |
|---|---|
| Nov 2025 | 145 mm, normal 119 mm |
| Dec 2025 | 204 mm, normal 155 mm |
| Jan 2026 | 82 mm, normal 165 mm |
| Feb 2026 | 328 mm, normal 153 mm |
| Mar 2026 | 170 mm, normal 141 mm |
| Apr 2026 | 178 mm, normal 93 mm |
| May 2026 | 110 mm, normal 39 mm |
| Jun 2026 | 34 mm, normal 25 mm |
| Jul 2026 | 49 mm, normal 20 mm |
| Aug 2026 | 19 mm, normal 32 mm |
| Sep 2026 | 172 mm, normal 32 mm |
| Oct 2026 | 45 mm, normal 91 mm |
The last twelve full months brought 1,536 mm; a normal year has 1,066 mm. Hottest days of the last year: 31.4 °C on 25 January 2026, 31.3 °C on 26 January 2026 and 31.3 °C on 4 February 2026.
Weather here is averaged over a 9 km grid; this ward overlaps 5 grid cells, each weighted by the ward’s area in it, and its neighbours draw on some of the same cells. Modelled estimates from a weather reanalysis, averaged over the whole place: not readings from a weather station, and not a forecast. The weather model runs about five days behind the weather, so the newest day here is usually five to twelve days ago.
Source: ERA5-Land, Copernicus Climate Change Service, averaged over Ward 11 of Senqu. Day by day, and every year since 1950
Greenness of this ward
0.37NDVI in October 2026
0.23a normal October, 1984 to 2020
Well above normalagainst normal
Tallest 0.47
NDJFMAMJJASO
Show the numbers
| When or what | Figure |
|---|---|
| Nov 2025 | 0.31, normal 0.24 |
| Dec 2025 | 0.36, normal 0.27 |
| Jan 2026 | 0.34, normal 0.29 |
| Feb 2026 | 0.37, normal 0.33 |
| Mar 2026 | 0.44, normal 0.35 |
| Apr 2026 | 0.47, normal 0.36 |
| May 2026 | 0.37, normal 0.31 |
| Jun 2026 | 0.33, normal 0.26 |
| Jul 2026 | 0.29, normal 0.22 |
| Aug 2026 | 0.26, normal 0.21 |
| Sep 2026 | 0.29, normal 0.21 |
| Oct 2026 | 0.37, normal 0.23 |
97% of the ward was seen through the clouds in October. A paler bar is a month seen over less than half the ward.
The greenness score (NDVI) is how green the land looks from space, from about 0 (bare ground, rock, water) to about 0.9 (dense green growth). It follows rain, season, crops and fire. A month’s figure is the mean over the whole place where the satellite saw the ground (clouds hide some).
Source: NDVI Anomaly and NDVI Climatology, Digital Earth Africa (CC BY 4.0), modified; Landsat imagery courtesy of the U.S. Geological Survey; contains modified Copernicus Sentinel data 2017 to 2026. Second reading: generated using European Union’s Copernicus Land Monitoring Service information (NDVI 300 m, version 3), modified. What we changed: we averaged Digital Earth Africa’s monthly NDVI over each 2026 ward at 240 m (its own 8 by 8 averages of the 30 m pixels) and wards up to municipalities, districts and provinces by area; CLMS’s three 10-day NDVI images a month averaged the same way.
Drought in this ward
No droughtin October 2026
+2.13the drought index
+1.81rain over 12 months, against normal
Show the numbers
| When or what | Figure |
|---|---|
| November 2024 | +0.43, no drought |
| December 2024 | −0.54, dry |
| January 2025 | −0.74, dry |
| February 2025 | −0.61, dry |
| March 2025 | +0.34, no drought |
| April 2025 | +0.91, no drought |
| May 2025 | +0.86, no drought |
| June 2025 | +0.91, no drought |
| July 2025 | +0.73, no drought |
| August 2025 | +0.85, no drought |
| September 2025 | +0.83, no drought |
| October 2025 | +0.66, no drought |
| November 2025 | +0.72, no drought |
| December 2025 | +1.05, no drought |
| January 2026 | +0.78, no drought |
| February 2026 | +1.23, no drought |
| March 2026 | +1.32, no drought |
| April 2026 | +1.79, no drought |
| May 2026 | +1.51, no drought |
| June 2026 | +1.75, no drought |
| July 2026 | +1.78, no drought |
| August 2026 | +1.45, no drought |
| September 2026 | +2.11, no drought |
| October 2026 | +2.13, no drought |
<a href="/drought/ward-21402011">The ward’s drought month by month, with the dams and rain</a>
The drought index puts four measures on one scale, each in standard deviations from its 1991 to 2020 normal for the time of year (minus is drier): rain over the last 3 months and the last 12 (from ERA5-Land), rain less evaporation over 12 months (ERA5-Drought’s SPEI, so a hot, dry year counts for more), and how green the land is (from space, since 2017). The index is their mean. Rain and evaporation are modelled estimates from a weather reanalysis, averaged over the whole place, not station readings; greenness is measured from space. This is not an official drought declaration: those come from the National Disaster Management Centre.
Source: Contains modified Copernicus Climate Change Service information 1950 to 2026 (ERA5-Land, for rain; ERA5-Drought, for SPEI). Neither the European Commission nor ECMWF is responsible for any use that may be made of the Copernicus information or data it contains. Greenness: NDVI Anomaly, Digital Earth Africa (CC BY 4.0), modified; Landsat imagery courtesy of the U.S. Geological Survey; contains modified Copernicus Sentinel data 2017 to 2026.
Fire in this ward
0fire detections, the twelve months to October 2026
0.0 haburnt in 7 of those months
Show the numbers
| When or what | Figure |
|---|---|
| November 2025 | 0 fire detections |
| December 2025 | 0 fire detections |
| January 2026 | 0 fire detections |
| February 2026 | 0 fire detections |
| March 2026 | 0 fire detections |
| April 2026 | 0 fire detections |
| May 2026 | 0 fire detections |
| June 2026 | 0 fire detections |
| July 2026 | 0 fire detections |
| August 2026 | 0 fire detections |
| September 2026 | 0 fire detections |
| October 2026 | 0 fire detections |
| November 2025 | 0.0 ha burnt (0.000% of the place) |
| December 2025 | 0.0 ha burnt (0.000% of the place) |
| January 2026 | 0.0 ha burnt (0.000% of the place) |
| February 2026 | 0.0 ha burnt (0.000% of the place) |
| March 2026 | 0.0 ha burnt (0.000% of the place) |
| April 2026 | 0.0 ha burnt (0.000% of the place) |
| May 2026 | 0.0 ha burnt (0.000% of the place) |
| June 2026 | not out yet |
| July 2026 | not out yet |
| August 2026 | not out yet |
| September 2026 | not out yet |
| October 2026 | not out yet |
The worst years since 2012: 2023 (19 detections), 2024 (14 detections), 2025 (12 detections).
<a href="/fire/ward-21402011">The ward’s fires month by month, and every year since 2012</a>
Hot spots seen from space by VIIRS (NASA FIRMS) and ground that looks burnt afterwards (Copernicus, 300 m); not fires reported on the ground.
Source: Fire detections: we acknowledge the use of data and/or imagery from NASA’s Fire Information for Resource Management System (FIRMS), part of NASA’s LANCE (VIIRS 375 m, S-NPP and NOAA-20). Burnt area: generated using European Union’s Copernicus Land Monitoring Service information (Burnt Area 300 m version 4, DOI 10.2909/8fa58061-28ab-49bb-9b77-c26b50733e34), modified; this does not mean the European Union endorses us.
Air in Senqu
18 µg/m³nitrogen dioxide near the ground, 2025’s mean
23 µg/m³in winter (12 µg/m³ in summer)
Air in 2025 (modelled): nitrogen dioxide near the ground averaged 18 µg/m³, 1.8 times WHO’s guideline of 10; winters 23 µg/m³, summers 12 µg/m³.
<a href="/air/senqu">Senqu’s air month by month since 2003</a> · <a href="/air">every municipality ranked</a>
Modelled, not measured: these figures come from the Copernicus Atmosphere Monitoring Service’s reanalysis, a weather and chemistry model that takes in satellite readings. Its cells are about 80 km across, so a busy road or a smoky winter evening in one suburb is smoothed into the region around it. It is not a reading at any address.
Source: Contains modified Copernicus Atmosphere Monitoring Service information 2003 to 2025. Neither the European Commission nor ECMWF is responsible for any use that may be made of the Copernicus information or data it contains.
Conditions in October 2026
October 2026: 45 mm of rain (normal 91 mm), hottest day 30.6 °C, greenness well above normal, no drought, no fire seen.
- Rain45 mm 50% of normalNormal 91 mm. Source: rainfall and temperature by ward, release of 5 November 2026.
- Hottest day30.6 °C0 days of 35 °C or more. Source: rainfall and temperature by ward, release of 5 November 2026.
- Greenness0.37 well above normalNormal 0.23. 97% of the place seen. Source: greenness by ward, release of 12 November 2026.
- DroughtNo drought index +2.13Steps from normal: 0 is normal, −1 is dry, −2 is very dry. Source: drought monitor by ward and municipality, release of 12 November 2026.
- Fire detections0 as usualNormal 0.5. Burnt area for October 2026 not out yet (it comes some weeks after). Source: burnt area and fire by ward, release of 12 November 2026.
- Surface water (2025, yearly)1.30 km² 157% of the 1991 to 2020 averageNormal 0.83 km². 1.01 km² permanent; 82% of the place seen. Source: surface water by ward, release of 12 November 2026.
- Dams that supply the placeNot linked yetWe hold every dam’s level (DWS) but no link yet between a dam and the places it supplies. Open Dams that supply the place
- AirNot out yetOur air figures (modelled, by municipality) come from a yearly reanalysis that reaches the end of last year, not this month. Open Air
Built only from our live releases. A gap is a gap: we show what we do not hold rather than fill it in. Rain and heat are worked out by a weather model; greenness, drought’s greenness part and fire are seen from space.
Sources, releases and how to cite
Rain: rainfall and temperature by ward, record ward-21402011-2026, release 2026-11-05.2. In the API (with a key): /v1/datasets/weather-by-ward/records?level=ward&code=21402011&year=2026
Hottest day: rainfall and temperature by ward, record ward-21402011-2026, release 2026-11-05.2. In the API (with a key): /v1/datasets/weather-by-ward/records?level=ward&code=21402011&year=2026
Greenness: greenness by ward, record ward-21402011-2026, release 2026-11-12. In the API (with a key): /v1/datasets/greenness-by-ward/records?level=ward&code=21402011&year=2026
Drought: drought monitor by ward and municipality, record ward-21402011-2026, release 2026-11-12. In the API (with a key): /v1/datasets/drought-index/records?level=ward&code=21402011&year=2026
Fire detections: burnt area and fire by ward, record ward-21402011-2026, release 2026-11-12. In the API (with a key): /v1/datasets/wildfire-history/records?level=ward&code=21402011&year=2026
Surface water (2025, yearly): surface water by ward, record ward-21402011, release 2026-11-12. In the API (with a key): /v1/datasets/surface-water-by-ward/records?level=ward&code=21402011
Each figure from the live release named beside it.
Land and people in this ward
9,500people in 2026, modelled
1.79 km²built-up in 2020, 1.2% of the ward
75.6%grassland in 2021
- grassland 76%
- cropland 13%
- shrubland 5.0%
- bare or sparse ground 3.7%
- built-up 1.4%
- open water 1.1%
Highest 1.79 km²Lowest 0.62 km²
197510 readings, every five years2020
Show the numbers
| When or what | Figure |
|---|---|
| 2020 | 1.79 km² |
| 2015 | 1.49 km² |
| 2010 | 1.26 km² |
| 2005 | 1.08 km² |
| 2000 | 0.95 km² |
| 1995 | 0.85 km² |
| 1990 | 0.78 km² |
| 1985 | 0.71 km² |
| 1980 | 0.65 km² |
| 1975 | 0.62 km² |
Highest 9,500Lowest 8,110
201512 years, one a year2026
Show the numbers
| When or what | Figure |
|---|---|
| 2026 | 9,500 |
| 2025 | 9,380 |
| 2024 | 9,270 |
| 2023 | 9,140 |
| 2022 | 9,010 |
| 2021 | 8,860 |
| 2020 | 8,710 |
| 2019 | 8,560 |
| 2018 | 8,410 |
| 2017 | 8,270 |
| 2016 | 8,300 |
| 2015 | 8,110 |
Built-up area: 0.62 km² in 1975, 1.79 km² in 2020. About 8,110 people in 2015 and 9,500 in 2026. A second model (GHS-POP) puts 2020 at about 7,220, against WorldPop’s 8,710.
The two built-up figures measure different things: land cover counts every 10 m square that is mostly built on, roads and gardens between the roofs included; built-up area counts only the roofs and paved ground themselves, so it is the smaller. People are a modelled estimate (WorldPop), not the census; GHS-POP is a second model. Built-up area is what the satellite sees, roofs and paved ground; it says nothing about who lives there or how. Shown for the ward as a whole, year by year; we do not name or outline any settlement.
Source: ESA WorldCover 2021 (CC BY 4.0), modified. GHSL, European Commission Joint Research Centre (CC BY 4.0), modified. WorldPop (www.worldpop.org), CC BY 4.0, modified. What we changed: we added up each grid’s 10 m or 100 m cells inside every 2026 ward (MDB boundaries; a cell belongs to the ward holding its centre) and added wards up to municipalities, districts and provinces.
Petrol here
R29.37 to R30.23a litre of petrol 95, province range
R29.00 to R29.86a litre of petrol 93
Highest R29.38Lowest R18.82
Nov 202160 changes keptToday
Show the numbers
| When or what | Figure |
|---|---|
| 4 November 2026 | R29.37 |
| 7 October 2026 | R29.38 |
| 2 September 2026 | R26.05 |
| 5 August 2026 | R24.71 |
| 1 July 2026 | R25.23 |
| 3 June 2026 | R27.19 |
| 6 May 2026 | R25.76 |
| 1 April 2026 | R22.49 |
| 4 March 2026 | R19.47 |
| 4 February 2026 | R19.27 |
| 7 January 2026 | R19.92 |
| 3 December 2025 | R20.58 |
| 5 November 2025 | R20.29 |
| 1 October 2025 | R20.80 |
| 3 September 2025 | R20.72 |
| 6 August 2025 | R20.76 |
| 2 July 2025 | R21.04 |
| 4 June 2025 | R20.52 |
| 7 May 2025 | R20.57 |
| 2 April 2025 | R20.79 |
| 5 March 2025 | R21.55 |
| 5 February 2025 | R21.62 |
| 1 January 2025 | R20.80 |
| 4 December 2024 | R20.68 |
| 6 November 2024 | R20.51 |
| 2 October 2024 | R20.26 |
| 4 September 2024 | R21.40 |
| 7 August 2024 | R22.32 |
| 4 July 2024 | R22.47 |
| 5 June 2024 | R23.46 |
| 1 May 2024 | R24.70 |
| 3 April 2024 | R24.33 |
| 6 March 2024 | R23.73 |
| 7 February 2024 | R22.52 |
| 3 January 2024 | R21.77 |
| 6 December 2023 | R22.53 |
| 1 November 2023 | R23.18 |
| 4 October 2023 | R24.96 |
| 6 September 2023 | R23.82 |
| 2 August 2023 | R22.11 |
| 5 July 2023 | R21.74 |
| 7 June 2023 | R21.91 |
| 3 May 2023 | R22.62 |
| 5 April 2023 | R22.25 |
| 1 March 2023 | R22.30 |
| 1 February 2023 | R21.03 |
| 4 January 2023 | R20.75 |
| 7 December 2022 | R22.81 |
| 2 November 2022 | R22.22 |
| 5 October 2022 | R21.71 |
| 7 September 2022 | R22.73 |
| 3 August 2022 | R24.77 |
| 6 July 2022 | R26.09 |
| 1 June 2022 | R23.52 |
| 4 May 2022 | R21.09 |
| 6 April 2022 | R21.24 |
| 2 March 2022 | R20.88 |
| 5 January 2022 | R18.89 |
| 1 December 2021 | R19.57 |
| 3 November 2021 | R18.82 |
From 4 November 2026. Down R0.01 on the month before. This is the range across the 15 fuel zones of Eastern Cape, not one price for this spot. No source we hold says which magisterial districts Senqu lies in, so we can’t name its zone yet. The next change is due on 2 December 2026. The graph is zone 1A.
Source: Government Gazette 55667 of 3 November 2026; zones from National Treasury’s list of magisterial districts. The fuel tool
Electricity here
R1,729.66a month for 500 kWh
Senquelectricity distributor
Cheapest household tariff open to a 60 A home (Domestic prepaid single phase (below 60 A), FBS). Prepaid, summer, VAT not stated by the source, so assumed excluded and added at 15%. Tariffs for 2026/27, from 1 July 2026. R1,552.39 in 2025/26. Up R177.27 (11.4%).
We can’t tell whether this exact spot buys from Senqu or straight from Eskom: Eskom supplies some areas itself and we have no map of them.
Source: NERSA decision for 2026/27, page 18. All 5 household tariffs
Tap water
0 of 14drinking water systems in Senqu at high or critical risk
- ELUNDINI LM - Maclear (Aucamp WTP) and (Mooiriver WTW)Medium risk
- ELUNDINI LM - Ugie (Ugie WTP)Medium risk
- ELUNDINI LM -Mt Fletcher (Mount Fletcher WTP)Low risk
- SENQU LM - Barkly East (Barkly East WTP)Medium risk
- SENQU LM - Lady Grey (Lady Grey WTW)Medium risk
- SENQU LM - Rhodes (Rhodes WTP)Low risk
- SENQU LM - Rossouw (Boreholes)Low risk
- SENQU LM - Sterkspruit (Sterkspruit WTP)Low risk
No system in the Blue Drop 2024 report is named for Ntsimekweni, so these are 8 of the 14 of Joe Gqabi District Municipality. We can’t say which one serves this spot.
The rating is the Department of Water and Sanitation’s view of the risk in each system, not a test of the water in your tap.
Source: Department of Water and Sanitation, Blue Drop Progress Assessment Report 2025: Eastern Cape, page 68. Tap water by town
The dams nearest
- Jozanashoek Dam17 km away100.1% full
- Egmont Dam63 km away96.5% full
- Welbedacht Dam87 km away96.7% full
In a straight line from the spot. They are not necessarily the dams that supply it: we hold no link yet between a dam and the towns it supplies. 3 of the dams in the weekly report have no position in our records and are left out.
Source: Department of Water and Sanitation, weekly State of Dams, 9 November 2026; positions from © OpenStreetMap contributors, ODbL 1.0. Every dam
The toll plazas nearest
In a straight line. Class 1 (a car), tariffs for 2026/27. Our records hold only tolls set by notice in the Government Gazette.
Source: toll tariff notices in the Government Gazette. Each plaza links to its notice.
What changes next
- 19 November2026Interest ratesThe Reserve Bank announces its decision. Prime is 10.75% now.
- 2 December2026PetrolThe monthly price change. Petrol 95 is from R29.37 now.
- 1 July2027ElectricityTariffs for 2027/28 are due. 500 kWh is R1,729.66 now.
Dates from each dataset’s own schedule. Every date · Add Senqu’s dates to your calendar
The notices behind these figures
- Petrol 95Government Gazette 55667 of 3 November 2026
- 500 kWh of electricityNERSA decision for 2026/27, page 18
- Minimum wageGovernment Gazette 54075, Notice R. 7083, page 4
- Prime lending rateRepo rate announced by the Reserve Bank, plus 3.5 points (the banks’ convention), in effect 25 September 2026
- The randEuropean Central Bank, euro reference rates of 13 November 2026
Each notice page lists every figure the notice set, with the page it is printed on.