Municipality
Umzimvubu Local Municipality
Local municipality. Official code EC442. 2,581 km².
Source: Municipality
Source: Municipal Demarcation Board, 2026 boundariesRelease 2026-11-07: Municipality
Places·Local municipality·Eastern Cape
A local municipality in the Alfred Nzo district of the Eastern Cape.
Municipality
Umzimvubu Local Municipality
Local municipality. Official code EC442. 2,581 km².
Source: Municipal Demarcation Board, 2026 boundariesRelease 2026-11-07: Municipality
District and province
Alfred Nzo, Eastern Cape
The district municipality sits between the municipality and the province.
Source: Municipal Demarcation Board, 2026 boundariesRelease 2026-11-07: District and province
Wards
28
On the 2026 boundaries, in force from 4 November 2026.
HistoryAlso 28 wards on the 2021 boundaries. The lines moved on 4 November 2026; the count did not.
Source: Municipal Demarcation Board, 2026 boundariesRelease 2026-11-07: WardsWhich ward am I in?
Electricity supplier
Eskom
Umzimvubu is not a licensed distributor, so homes here buy from Eskom directly. Eskom’s own tariffs are not in our data.
Source: NERSA, licensed distributors for 2026/27Release 2026-11-12.2: Electricity supplier
Water services
Alfred Nzo District Municipality
Responsible for drinking water and wastewater here. The district, not the municipality, is the authority.
Source: Department of Water and Sanitation, Blue Drop Progress Assessment Report 2025: Eastern Cape, page 44Release 2026-11-12: Water services
Fuel zone
Zone 12B
From the magisterial district named like its towns: Umzimvubu. The zone sets what petrol costs.
Source: National Treasury, list of magisterial districts and fuel zonesRelease 2026-10-07: Fuel zone
Its district: Alfred Nzo
What we can’t tell you here yet
Petrol 95 Down R0.01
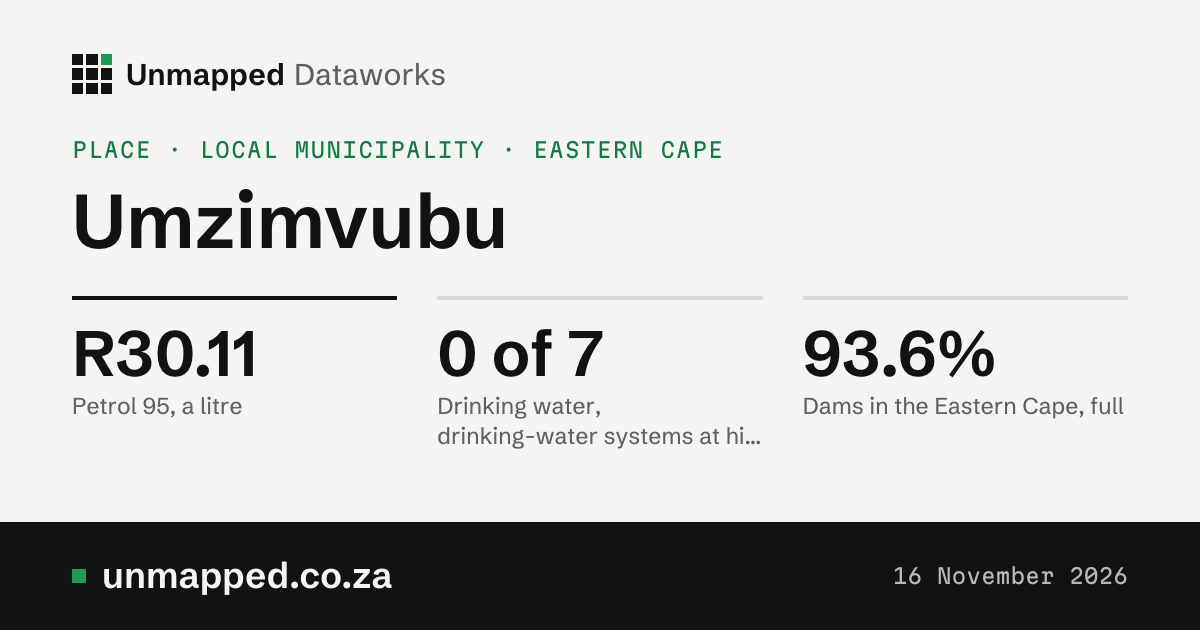
R30.11 a litre
From 4 November 2026. 1c less than last month and R9.09 more than a year ago. Zone 12B.
HistoryA year ago: R21.02. In November 2021: R19.46.
Source: Government Gazette 55667 of 3 November 2026Notice page: Petrol 95Release 2026-11-04: Petrol 95Fuel prices in Umzimvubu
Tolls
No toll plazas None found
No toll plazas inside Umzimvubu. (Tolls that are not set in the Government Gazette are not in our data, and 1 gazetted toll point has no position yet.)
Source: Toll tariff notices in the Government Gazette, 2018 to 2026Release 2026-11-13: Tolls
Minimum wage Same everywhere
R30.23 an hour
The national minimum, from 1 March 2026. Many jobs have their own, higher minimum.
Prime lending rate Same everywhere Up 0.25
10.75% a year
Since 25 September 2026, when the repo rate rose to 7.25%. Most home loans follow prime.
HistoryWas 10.50%. Lowest since 2015: 7.00% in July 2020. Highest: 11.75% in May 2023.
Source: Repo rate announced by the Reserve Bank, plus 3.5 points (the banks’ convention), in effect 25 September 2026Notice page: Prime lending rateRelease 2026-11-09.3: Prime lending rateInterest rates
The rand Same everywhere
R16.96 to the US dollar
On 13 November 2026, the newest business day. Worked out from the European Central Bank’s reference rates.
HistoryA year before: R17.00.
Source: European Central Bank, euro reference rates of 13 November 2026Notice page: The randRelease 2026-11-13: The randThe rand
What we can’t tell you here yet
Drinking water
0 of 7 drinking-water systems at high or critical risk
None is rated high or critical. Blue Drop risk ratings, 2024. These are all of Alfred Nzo’s, because the district is the water services authority.
HistoryIn the 2023 report: 1 of 7. Two report years so far.
Source: Department of Water and Sanitation, Blue Drop Progress Assessment Report 2025: Eastern Cape, pages 44 and 45Release 2026-11-12: Drinking waterEvery system here
Wastewater works
3 of 6 at high or critical risk
Bizana, Cedarville and Matatielle. Green Drop, 2024. These are all of Alfred Nzo’s, because the district is the water services authority.
Source: Department of Water and Sanitation, Green Drop Report 2025: Eastern Cape, pages 66 and 67Release 2026-11-12: Wastewater works
Water lost before it reaches a tap
Medium risk
Alfred Nzo District Municipality is rated medium (53.3%) in the 2025 No Drop report.
Source: Department of Water and Sanitation, No Drop Progress Assessment Report 2025 (complete), page 51Release 2026-11-12: Water lost before it reaches a tap
Dams in the Eastern Cape Province
93.6% full
Weekly report of 9 November 2026. All 47 dams of the province in the report, weighted by size. Umtata Dam is 101.2% full. They are not necessarily the dams that supply Umzimvubu.
HistoryA year ago: 75.4%. A new report every Monday.
Source: Department of Water and Sanitation, weekly State of Dams, 9 November 2026Release 2026-11-09.2: Dams in the Eastern CapeEvery dam
Weather, November so far
31.3 °C hottest day
48 mm of rain from 1 to 5 November 2026; a normal November has 126 mm. Hottest on 5 November 2026. Weather here is averaged over a 9 km grid: the 35 grid cells the municipality overlaps, each weighted by its area in it. Modelled estimates from a weather reanalysis, averaged over the whole place: not readings from a weather station, and not a forecast.
HistoryRain, month by month. The twelve months from November 2025 to October 2026. Daily figures run to 5 November 2026.
Source: ERA5-Land, Copernicus Climate Change Service, to 5 November 2026. Contains modified Copernicus Climate Change Service information 2026. Neither the European Commission nor ECMWF is responsible for any use that may be made of the Copernicus information or data it contains.Release 2026-11-05.2: Weather, November so farDay by day, and every year since 1950
Land cover, 2021
65% grassland
Of the land ESA WorldCover maps here in 2021: grassland 65%, trees 14%, shrubland 12%, cropland 6.8%. The shares add up to 100%.
Source: ESA WorldCover 2021 (CC BY 4.0), modified.Release 2026-11-12: Land cover, 2021
Built-up area, 2020
35.5 km² 1.4% of the place
Roofs and paved ground as the satellite sees them (GHSL), every five years. 7.40 km² in 1975. It says nothing about who lives there or how. The two built-up figures measure different things: land cover counts every 10 m square that is mostly built on, roads and gardens between the roofs included; built-up area counts only the roofs and paved ground themselves, so it is the smaller.
History7.40 km² in 1975.
Source: GHSL, European Commission Joint Research Centre (CC BY 4.0), modified.Release 2026-11-12: Built-up area, 2020
People, 2026 (modelled)
225,200 about 87 a km²
An estimate from satellite-based models, not the census. Two models differ by about 8%.
HistoryAbout 194,000 in 2015.
Source: WorldPop (www.worldpop.org), CC BY 4.0, modified.Release 2026-11-12: People, 2026 (modelled)
Greenness, October 2026 Well above normal
0.52 on the greenness scale
How green the whole place looks from space; a normal October is 0.37, so well above normal. The scale runs from about 0 (bare ground) to about 0.9 (thick green growth). The satellite saw 99% of the area.
HistoryThe last twelve months.
Source: NDVI Anomaly and NDVI Climatology, Digital Earth Africa (CC BY 4.0), modified; Landsat imagery courtesy of the U.S. Geological Survey; contains modified Copernicus Sentinel data 2017 to 2026. Second reading: generated using European Union’s Copernicus Land Monitoring Service information (NDVI 300 m, version 3), modified.Release 2026-11-12: Greenness, October 2026
Drought, October 2026
No drought score +1.42 (0 is normal)
From rain over the last 3 and 12 months, evaporation and how green the land is, against the usual for the time of year: 0 is normal, −1 is dry, −2 is very dry. Our estimate, not an official drought declaration.
HistoryThe index, the last two years.
Source: Contains modified Copernicus Climate Change Service information 1950 to 2026 (ERA5-Land, for rain; ERA5-Drought, for SPEI). Neither the European Commission nor ECMWF is responsible for any use that may be made of the Copernicus information or data it contains. Greenness: NDVI Anomaly, Digital Earth Africa (CC BY 4.0), modified; Landsat imagery courtesy of the U.S. Geological Survey; contains modified Copernicus Sentinel data 2017 to 2026.Release 2026-11-12: Drought, October 2026Every month since 1951, with the dams
Fire, the twelve months to October 2026
756 fire detections
Fires spotted from space by NASA’s fire-spotting satellites, counted where they fall in the place; 63 ha burnt in 7 of those months (the rest not out yet). The most since 2012: 2013, 1,381. Seen from space, not fires reported on the ground.
HistoryFire detections each month.
Source: Fire detections: we acknowledge the use of data and/or imagery from NASA’s Fire Information for Resource Management System (FIRMS), part of NASA’s LANCE (VIIRS 375 m, S-NPP and NOAA-20). Burnt area: generated using European Union’s Copernicus Land Monitoring Service information (Burnt Area 300 m version 4, DOI 10.2909/8fa58061-28ab-49bb-9b77-c26b50733e34), modified; this does not mean the European Union endorses us.Release 2026-11-12: Fire, the twelve months to October 2026Every month since 2012, and the worst years
Surface water, 2025
6.23 km² on average
Open water seen from space over the year: each spot counts for the share of clear looks it was wet; 2.95 km² was water nearly all year, 22.5 km² at some point. 61% of the place was seen clearly. The most since 1984: 1997, 9.03 km². Seen from space, not a survey; a missing year is left out, not counted as dry.
HistoryThe average water area each year since 1984.
Source: Water Observations from Space, Digital Earth Africa (CC BY 4.0), modified (counted over each 2026 place by Unmapped). Landsat imagery courtesy of the U.S. Geological Survey.Release 2026-11-12: Surface water, 2025Every year since 1984, the wettest and driest, and every municipality ranked
Nitrogen dioxide in the air, 2025
6.1 µg/m³, the year’s mean (modelled)
Near the ground, averaged over the whole place by a European air-quality model, not a reading at any address. WHO’s yearly guideline is 10 µg/m³. Winters 10 µg/m³, summers 3.3 µg/m³ over the last five years.
HistoryEach year’s mean since 2003.
Source: Contains modified Copernicus Atmosphere Monitoring Service information 2003 to 2025. Neither the European Commission nor ECMWF is responsible for any use that may be made of the Copernicus information or data it contains.Release 2026-11-12: Nitrogen dioxide in the air, 2025Month by month since 2003, and every municipality ranked
How hot the ground got, summer 2025 to 26
35.6 °C on clear mornings
How hot the ground itself gets (roofs, roads, soil, leaves), seen from space at about 10 in the morning, averaged over the municipality. It is not the air temperature; on a sunny day the ground is often far hotter.
HistoryEach summer since 1987 (December to February).
Source: Landsat imagery courtesy of the U.S. Geological Survey (Landsat Collection 2 surface temperature, through Digital Earth Africa’s copy).Release 2026-11-13: How hot the ground got, summer 2025 to 26Every summer, month by month, and the wards
Night light seen from space, 2025
0.23 nW/cm²/sr on average, 5.2% of the land lit
NASA Black Marble at about 1:30 in the morning, averaged over the municipality; 229% brighter than 2012. Light, nothing more: it can't tell grid from solar, or who pays.
HistoryEach year's brightness since 2012.
Source: NASA Black Marble night lights, VNP46A3 (monthly) and VNP46A4 (yearly), collection 2, from NASA’s LAADS DAAC (doi:10.5067/VIIRS/VNP46A3.002 and doi:10.5067/VIIRS/VNP46A4.002).Release 2026-11-13: Night light seen from space, 2025Every year and month since 2012
What we can’t tell you here yet
October 2026: 127 mm of rain (normal 93 mm), hottest day 31.2 °C, greenness well above normal, no drought, 15 fire detections.
Built only from our live releases. A gap is a gap: we show what we do not hold rather than fill it in. Rain and heat are worked out by a weather model; greenness, drought’s greenness part and fire are seen from space.
Rain: rainfall and temperature by ward, record municipality-EC442-2026, release 2026-11-05.2. In the API (with a key): /v1/datasets/weather-by-ward/records?level=municipality&code=EC442&year=2026
Hottest day: rainfall and temperature by ward, record municipality-EC442-2026, release 2026-11-05.2. In the API (with a key): /v1/datasets/weather-by-ward/records?level=municipality&code=EC442&year=2026
Greenness: greenness by ward, record municipality-EC442-2026, release 2026-11-12. In the API (with a key): /v1/datasets/greenness-by-ward/records?level=municipality&code=EC442&year=2026
Drought: drought monitor by ward and municipality, record municipality-EC442-2026, release 2026-11-12. In the API (with a key): /v1/datasets/drought-index/records?level=municipality&code=EC442&year=2026
Fire detections: burnt area and fire by ward, record municipality-EC442-2026, release 2026-11-12. In the API (with a key): /v1/datasets/wildfire-history/records?level=municipality&code=EC442&year=2026
Surface water (2025, yearly): surface water by ward, record municipality-EC442, release 2026-11-12. In the API (with a key): /v1/datasets/surface-water-by-ward/records?level=municipality&code=EC442
For farmers in Umzimvubu: the season, the nearest dams and the costs
Dates from each dataset’s own schedule.Add these dates to your calendarThe .ics fileEvery dataset’s next date
Old figures are kept, never overwritten.Every release
How to read this page
Unmapped Dataworks