Compare · two places side by side
eThekwini and Nelson Mandela Bay
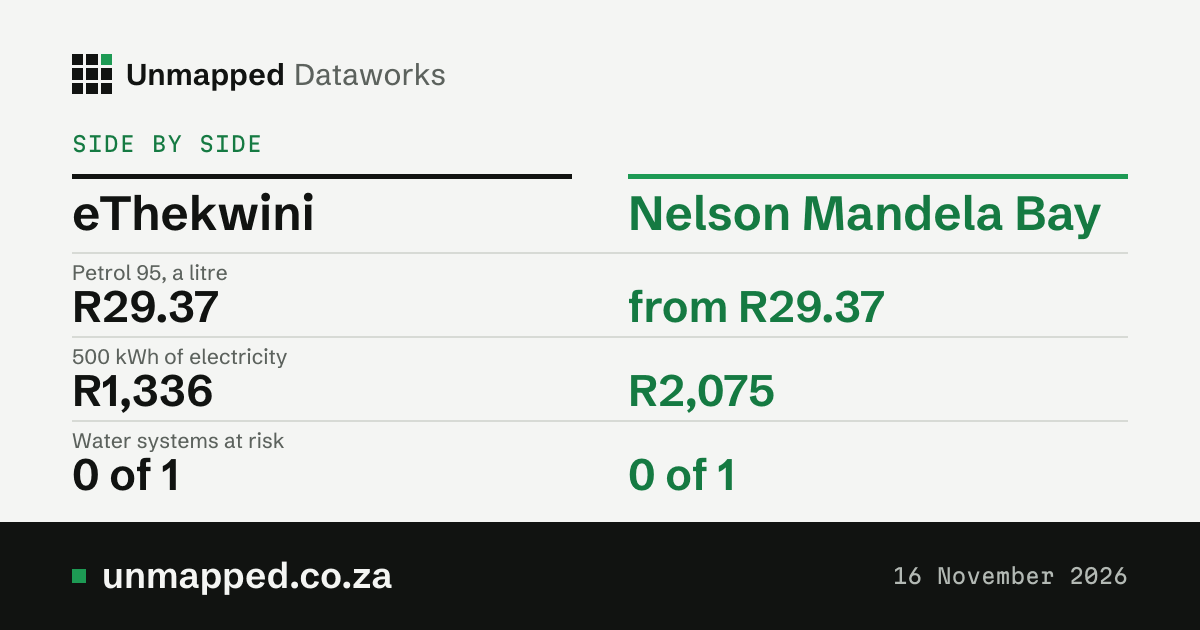
Every figure we hold for both, side by side. The first place is in black, the second in green, all the way down.
Side by side · 16 November 2026
- Petrol 95, a litre
- R29.37
- from R29.37
- 500 kWh of electricity
- R1,336
- R2,075
- Water systems at risk
- 0 of 1
- 0 of 1
- Dams, full
- 84.4%
- 93.6%
Change the places
Petrol
eThekwini
R29.37
a litre of petrol 95, fuel zone 1A
Nelson Mandela Bay
R29.37 to R29.43
a litre, the range over fuel zones 1A and 2A
A litre of petrol 95 is R29.37 in eThekwini and R29.37 to R29.43 in Nelson Mandela Bay. Petrol is priced by fuel zone, and we can’t tell which zone Nelson Mandela Bay is in, so we give the range and not one difference.
Highest R29.38Lowest R18.82
Nov 2021Today
Prices from 4 November 2026. The pump price of petrol is set by zone, once a month. The next change is due on 2 December 2026.
Source: Government Gazette 55667 of 3 November 2026; zones from National Treasury’s list of magisterial districts. The fuel tool
Electricity
eThekwini
R1,335.67
a month for 500 kWh, from eThekwini Municipality
Nelson Mandela Bay
R2,075.07
a month for 500 kWh, from Nelson Mandela Bay
500 kWh of electricity costs R739.40 more a month in Nelson Mandela Bay than in eThekwini: 55.4% more.
Each bill is the cheapest household tariff open to a 60 A home, prepaid, in summer, VAT included, at the tariffs NERSA approved for 2026/27.
Source: NERSA decision for 2026/27, page 21. The bill calculator
Tap water
eThekwini
0 of 1
drinking water system at high or critical risk, Blue Drop 2024
Nelson Mandela Bay
0 of 1
drinking water system at high or critical risk, Blue Drop 2024
The one drinking water system of eThekwini is not rated high or critical risk. The one drinking water system of Nelson Mandela Bay is not rated high or critical risk.
The rating is the Department of Water and Sanitation’s view of the risk in each system, by municipality. It is not a test of the water in a tap.
Source: Department of Water and Sanitation, Blue Drop Progress Assessment Report 2025: KwaZulu-Natal, page 48; Blue Drop Progress Assessment Report 2025: Eastern Cape, page 83. Tap water by town
Dams
eThekwini
84.4%
full: the dams of KwaZulu-Natal, taken together
Nelson Mandela Bay
93.6%
full: the dams of Eastern Cape, taken together
The dams of Eastern Cape are 9.2 points fuller than the dams of KwaZulu-Natal.
A province’s dams are weighed by how much each holds. They are not necessarily the dams that supply one town.
Source: Department of Water and Sanitation, weekly State of Dams, 9 November 2026. Every dam
Weather in November, against a normal November
eThekwini
40 mm
rain so far in November; a whole normal November has 108 mm
Nelson Mandela Bay
11 mm
rain so far in November; a whole normal November has 61 mm
eThekwini has had more rain so far in November: 40 mm against 11 mm (1 to 5 November). The hottest day this month was 30.3 °C in eThekwini, on 5 November, and 27.0 °C in Nelson Mandela Bay, on 5 November.
Averaged over eThekwini and Nelson Mandela Bay. Modelled estimates from a weather reanalysis, averaged over the whole place: not readings from a weather station, and not a forecast. The weather model runs about five days behind the weather, so the newest day here is usually five to twelve days ago.
Source: ERA5-Land, Copernicus Climate Change Service. Weather by place
A year of rain
eThekwini
812 mm
in the last twelve full months; a normal year has 902 mm
Nelson Mandela Bay
803 mm
in the last twelve full months; a normal year has 521 mm
eThekwini had 9 mm more rain in the last twelve full months. eThekwini had 812 mm, 90% of a normal year there. Nelson Mandela Bay had 803 mm, 154% of a normal year there.
NDJFMAMJJASO
Source: ERA5-Land, Copernicus Climate Change Service; normals are the 1991 to 2020 averages.
The same in both
- Minimum wage
- R30.23 an hour Find your job
- Prime lending rate
- 10.75% a year Interest rates
- The rand
- R16.96 to the US dollar The rand
These are national figures. They are the same in every place in South Africa, so there is no difference to show.
Sources: Government Gazette 54075, Notice R. 7083, page 4; Repo rate announced by the Reserve Bank, plus 3.5 points (the banks’ convention), in effect 25 September 2026; European Central Bank, euro reference rates of 13 November 2026.
What changes next
- 19 November2026Interest ratesThe Reserve Bank announces its decision. Prime is 10.75% now.Both places
- 2 December2026PetrolThe monthly price change.Both places
- 1 March2027TollsNext year’s toll tariffs are due about now, by Gazette notice.Only eThekwini
- 1 July2027ElectricityTariffs for 2027/28 are due.Both places
Dates from each dataset’s own schedule. Every date · Calendar feeds