Responsible for drinking water and wastewater here. The district, not the municipality, is the authority.
Source: Water services
Source: Department of Water and Sanitation, Blue Drop Progress Assessment Report 2025: Limpopo, page 45Release 2026-11-12: Water services
Fuel zone Province
One of 11 in Limpopo
Fuel zones follow magisterial districts, and no source we hold says which districts Lepele-Nkumpi lies in. So we cannot name its zone yet. Limpopo has zones 10C, 11C, 12C, 13C, 14C, 16C, 61C, 62C and 3 more.
No toll plazas inside Lepele-Nkumpi. (Tolls that are not set in the Government Gazette are not in our data, and 1 gazetted toll point has no position yet.)
Water, sanitation and refuse tariffsNot in our data yet
Vehicle licence feesNot in our data yet
03
How it’s doing
Drinking water
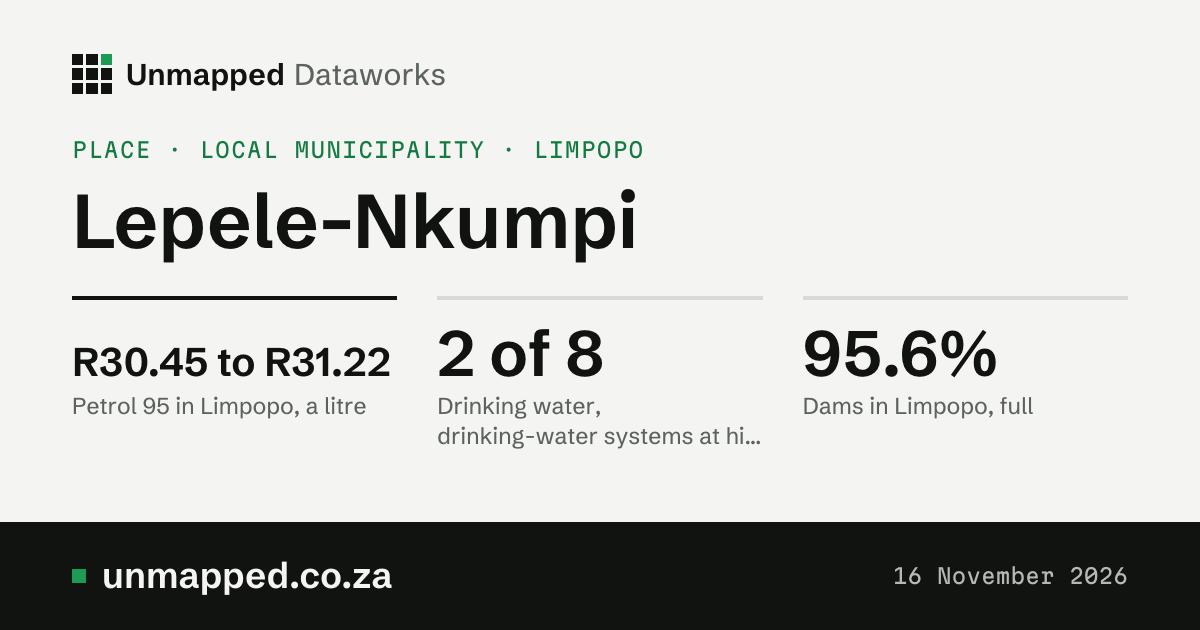
2 of 8 drinking-water systems at high or critical risk
At high or critical risk: Bodutlolo Water Supply System and Senwabarwana Water Supply Systems. Blue Drop risk ratings, 2024. These are all of Capricorn’s, because the district is the water services authority.
History and source: Drinking water
HistoryIn the 2023 report: 3 of 7. Two report years so far.
Weekly report of 9 November 2026. All 29 dams of the province in the report, weighted by size. De Hoop Dam is 98.8% full. They are not necessarily the dams that supply Lepele-Nkumpi.
History and source: Dams in Limpopo
HistoryA year ago: 80.1%. A new report every Monday.
8.5 mm of rain from 1 to 5 November 2026; a normal November has 90 mm. Hottest on 1 November 2026; 1 day of 35 °C or more. Weather here is averaged over a 9 km grid: the 44 grid cells the municipality overlaps, each weighted by its area in it. Modelled estimates from a weather reanalysis, averaged over the whole place: not readings from a weather station, and not a forecast.
History and source: Weather, November so far
HistoryRain, month by month. The twelve months from November 2025 to October 2026. Daily figures run to 5 November 2026.
Roofs and paved ground as the satellite sees them (GHSL), every five years. 15.1 km² in 1975. It says nothing about who lives there or how. The two built-up figures measure different things: land cover counts every 10 m square that is mostly built on, roads and gardens between the roofs included; built-up area counts only the roofs and paved ground themselves, so it is the smaller.
How green the whole place looks from space; a normal October is 0.28, so well above normal. The scale runs from about 0 (bare ground) to about 0.9 (thick green growth). The satellite saw 100% of the area.
From rain over the last 3 and 12 months, evaporation and how green the land is, against the usual for the time of year: 0 is normal, −1 is dry, −2 is very dry. Our estimate, not an official drought declaration.
Fires spotted from space by NASA’s fire-spotting satellites, counted where they fall in the place; 82 ha burnt in 7 of those months (the rest not out yet). The most since 2012: 2024, 1,815. Seen from space, not fires reported on the ground.
History and source: Fire, the twelve months to October 2026
Open water seen from space over the year: each spot counts for the share of clear looks it was wet; 1.77 km² was water nearly all year, 31.8 km² at some point. 62% of the place was seen clearly. The most since 1984: 1996, 8.59 km². Seen from space, not a survey; a missing year is left out, not counted as dry.
History and source: Surface water, 2025
HistoryThe average water area each year since 1984.
Near the ground, averaged over the whole place by a European air-quality model, not a reading at any address. WHO’s yearly guideline is 10 µg/m³. Winters 13 µg/m³, summers 4.4 µg/m³ over the last five years.
History and source: Nitrogen dioxide in the air, 2025
How hot the ground itself gets (roofs, roads, soil, leaves), seen from space at about 10 in the morning, averaged over the municipality. It is not the air temperature; on a sunny day the ground is often far hotter.
History and source: How hot the ground got, summer 2025 to 26
HistoryEach summer since 1987 (December to February).
NASA Black Marble at about 1:30 in the morning, averaged over the municipality; 97% brighter than 2012. Light, nothing more: it can't tell grid from solar, or who pays.
History and source: Night light seen from space, 2025
Greenness0.40 well above normalNormal 0.28. 100% of the place seen. Source: greenness by ward, release of 12 November 2026.
DroughtNo drought index +1.82Steps from normal: 0 is normal, −1 is dry, −2 is very dry. Source: drought monitor by ward and municipality, release of 12 November 2026.
Fire detections358 271% of the usual OctoberNormal 132. Burnt area for October 2026 not out yet (it comes some weeks after). Source: burnt area and fire by ward, release of 12 November 2026.
Surface water (2025, yearly)4.21 km² 182% of the 1991 to 2020 averageNormal 2.31 km². 1.77 km² permanent; 62% of the place seen. Source: surface water by ward, release of 12 November 2026.
Dams that supply the placeNot linked yetWe hold every dam’s level (DWS) but no link yet between a dam and the places it supplies. Open Dams that supply the place
AirNot out yetOur air figures (modelled, by municipality) come from a yearly reanalysis that reaches the end of last year, not this month. Open Air
Built only from our live releases. A gap is a gap: we show what we do not hold rather than fill it in. Rain and heat are worked out by a weather model; greenness, drought’s greenness part and fire are seen from space.
Sources, releases and how to cite
Rain: rainfall and temperature by ward, record municipality-LIM355-2026, release 2026-11-05.2. In the API (with a key): /v1/datasets/weather-by-ward/records?level=municipality&code=LIM355&year=2026
Hottest day: rainfall and temperature by ward, record municipality-LIM355-2026, release 2026-11-05.2. In the API (with a key): /v1/datasets/weather-by-ward/records?level=municipality&code=LIM355&year=2026
Greenness: greenness by ward, record municipality-LIM355-2026, release 2026-11-12. In the API (with a key): /v1/datasets/greenness-by-ward/records?level=municipality&code=LIM355&year=2026
Drought: drought monitor by ward and municipality, record municipality-LIM355-2026, release 2026-11-12. In the API (with a key): /v1/datasets/drought-index/records?level=municipality&code=LIM355&year=2026
Fire detections: burnt area and fire by ward, record municipality-LIM355-2026, release 2026-11-12. In the API (with a key): /v1/datasets/wildfire-history/records?level=municipality&code=LIM355&year=2026
Surface water (2025, yearly): surface water by ward, record municipality-LIM355, release 2026-11-12. In the API (with a key): /v1/datasets/surface-water-by-ward/records?level=municipality&code=LIM355